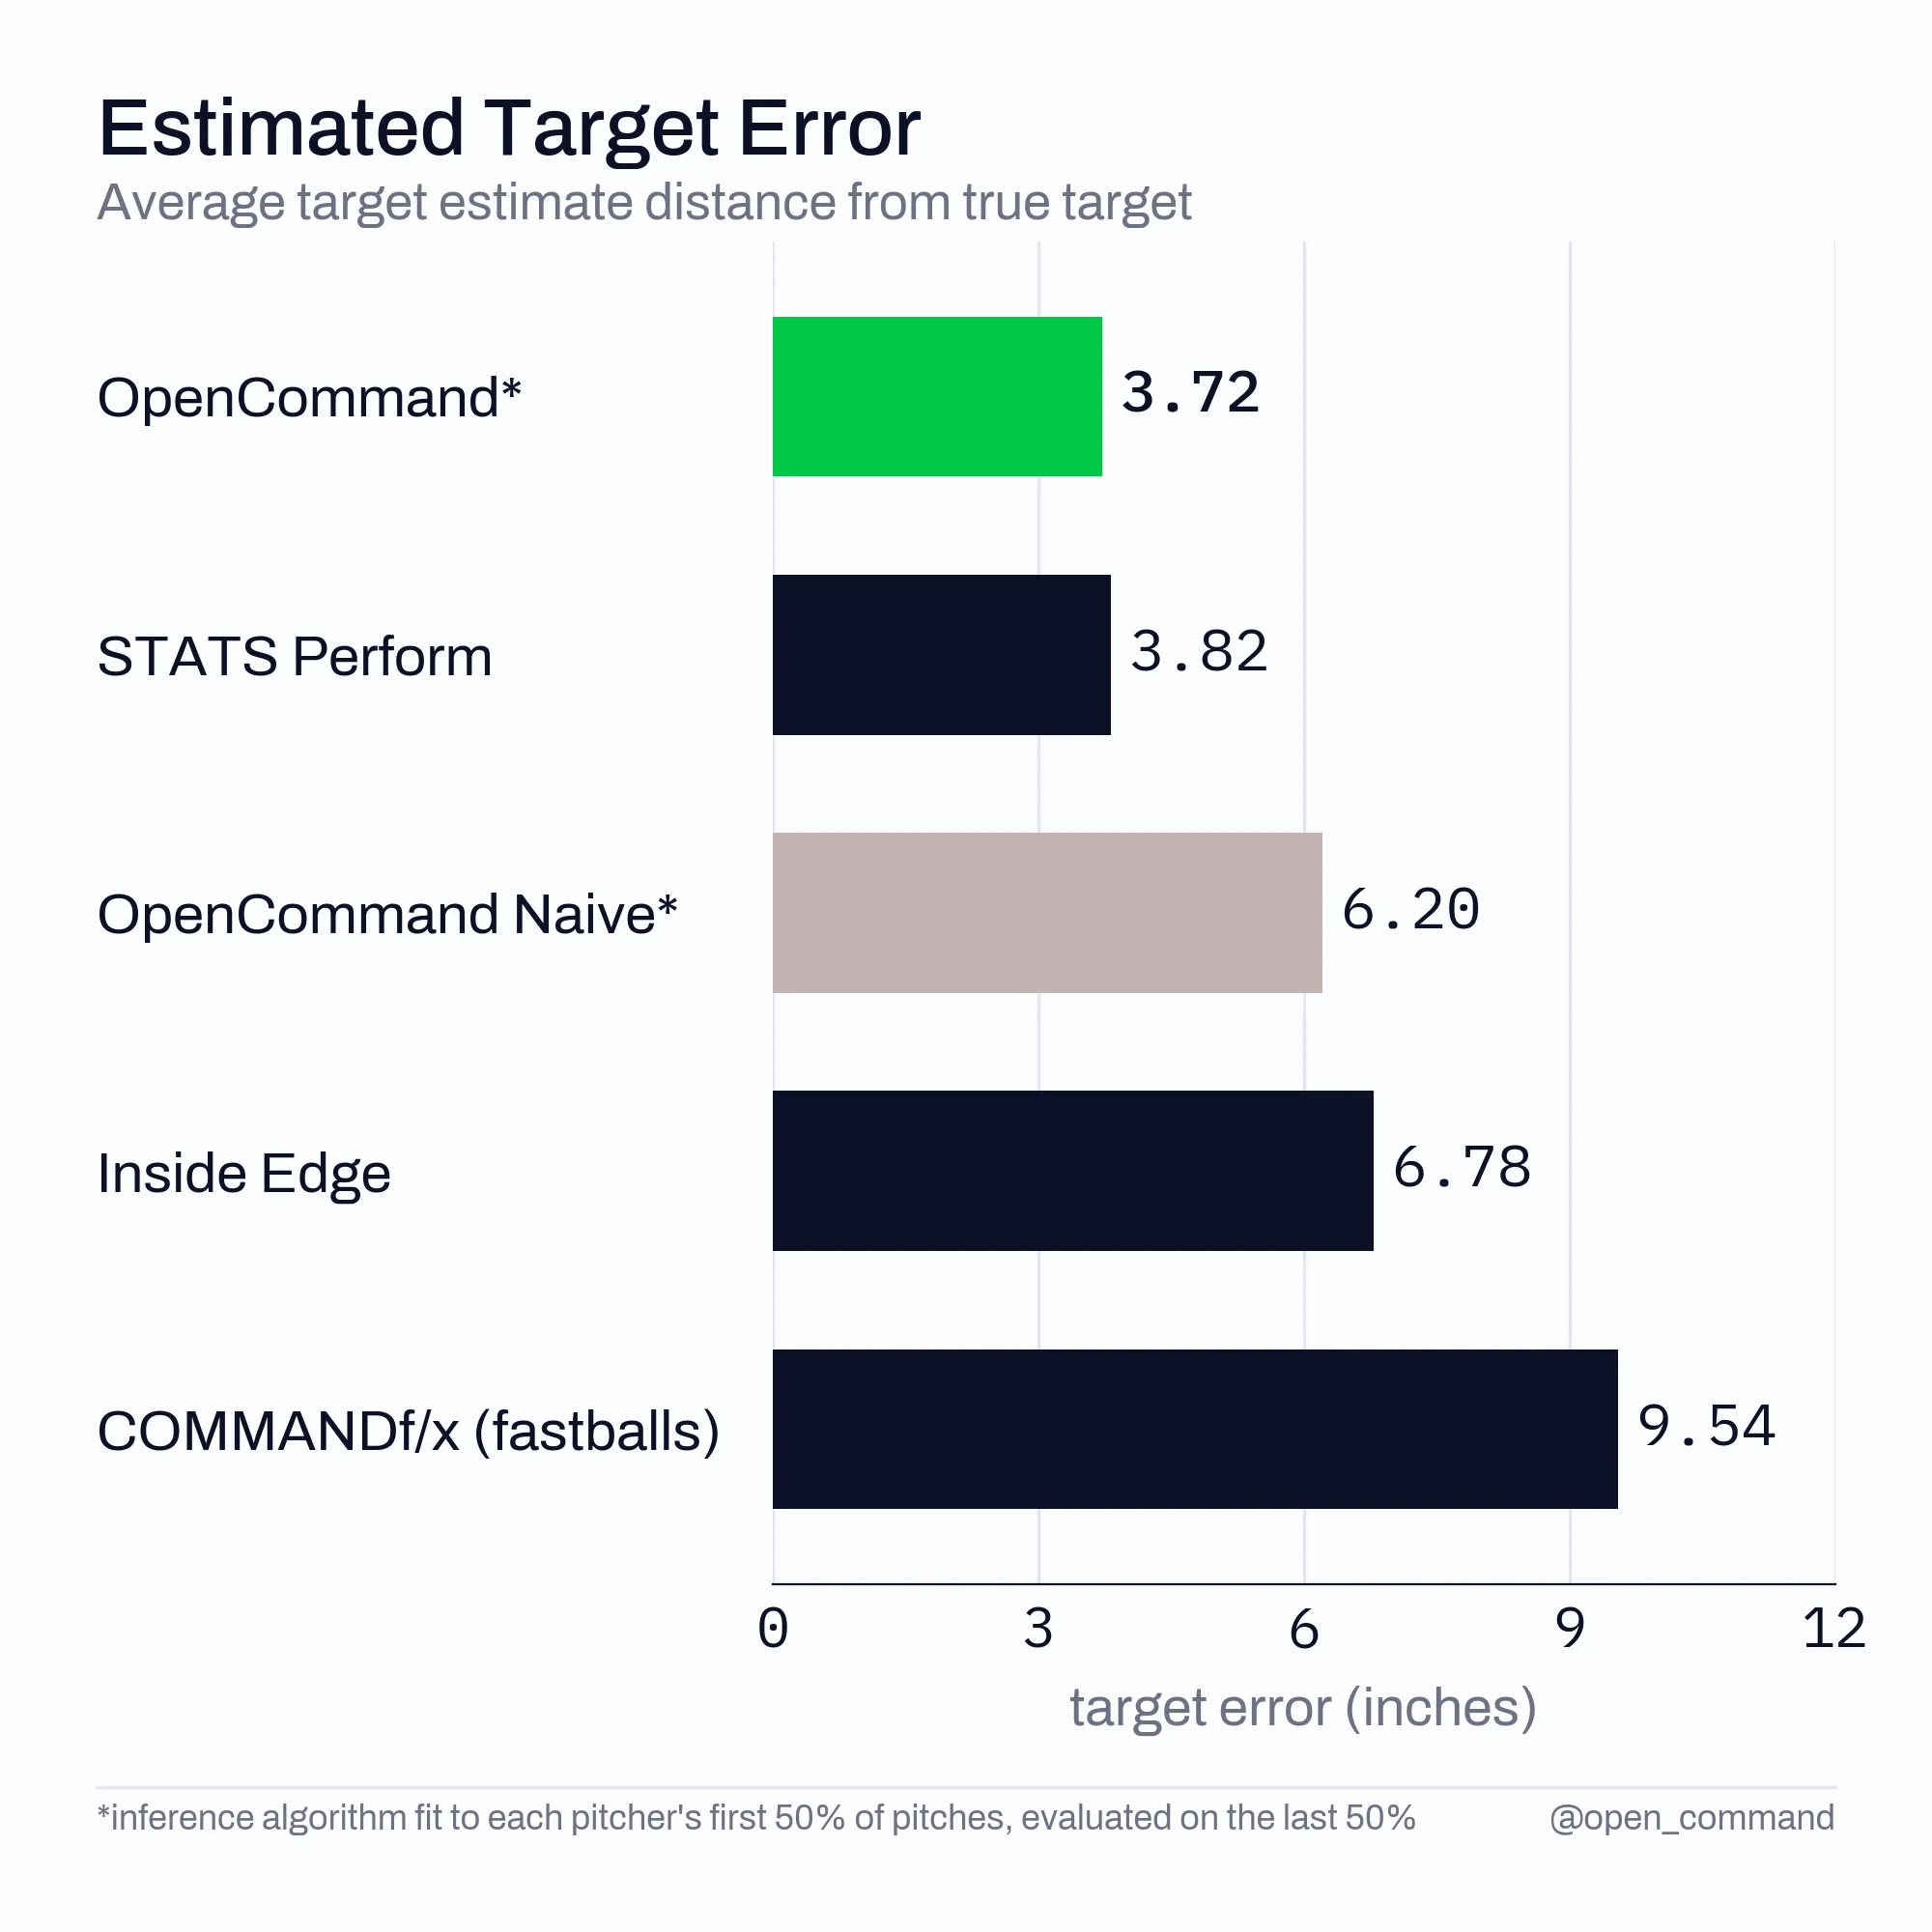
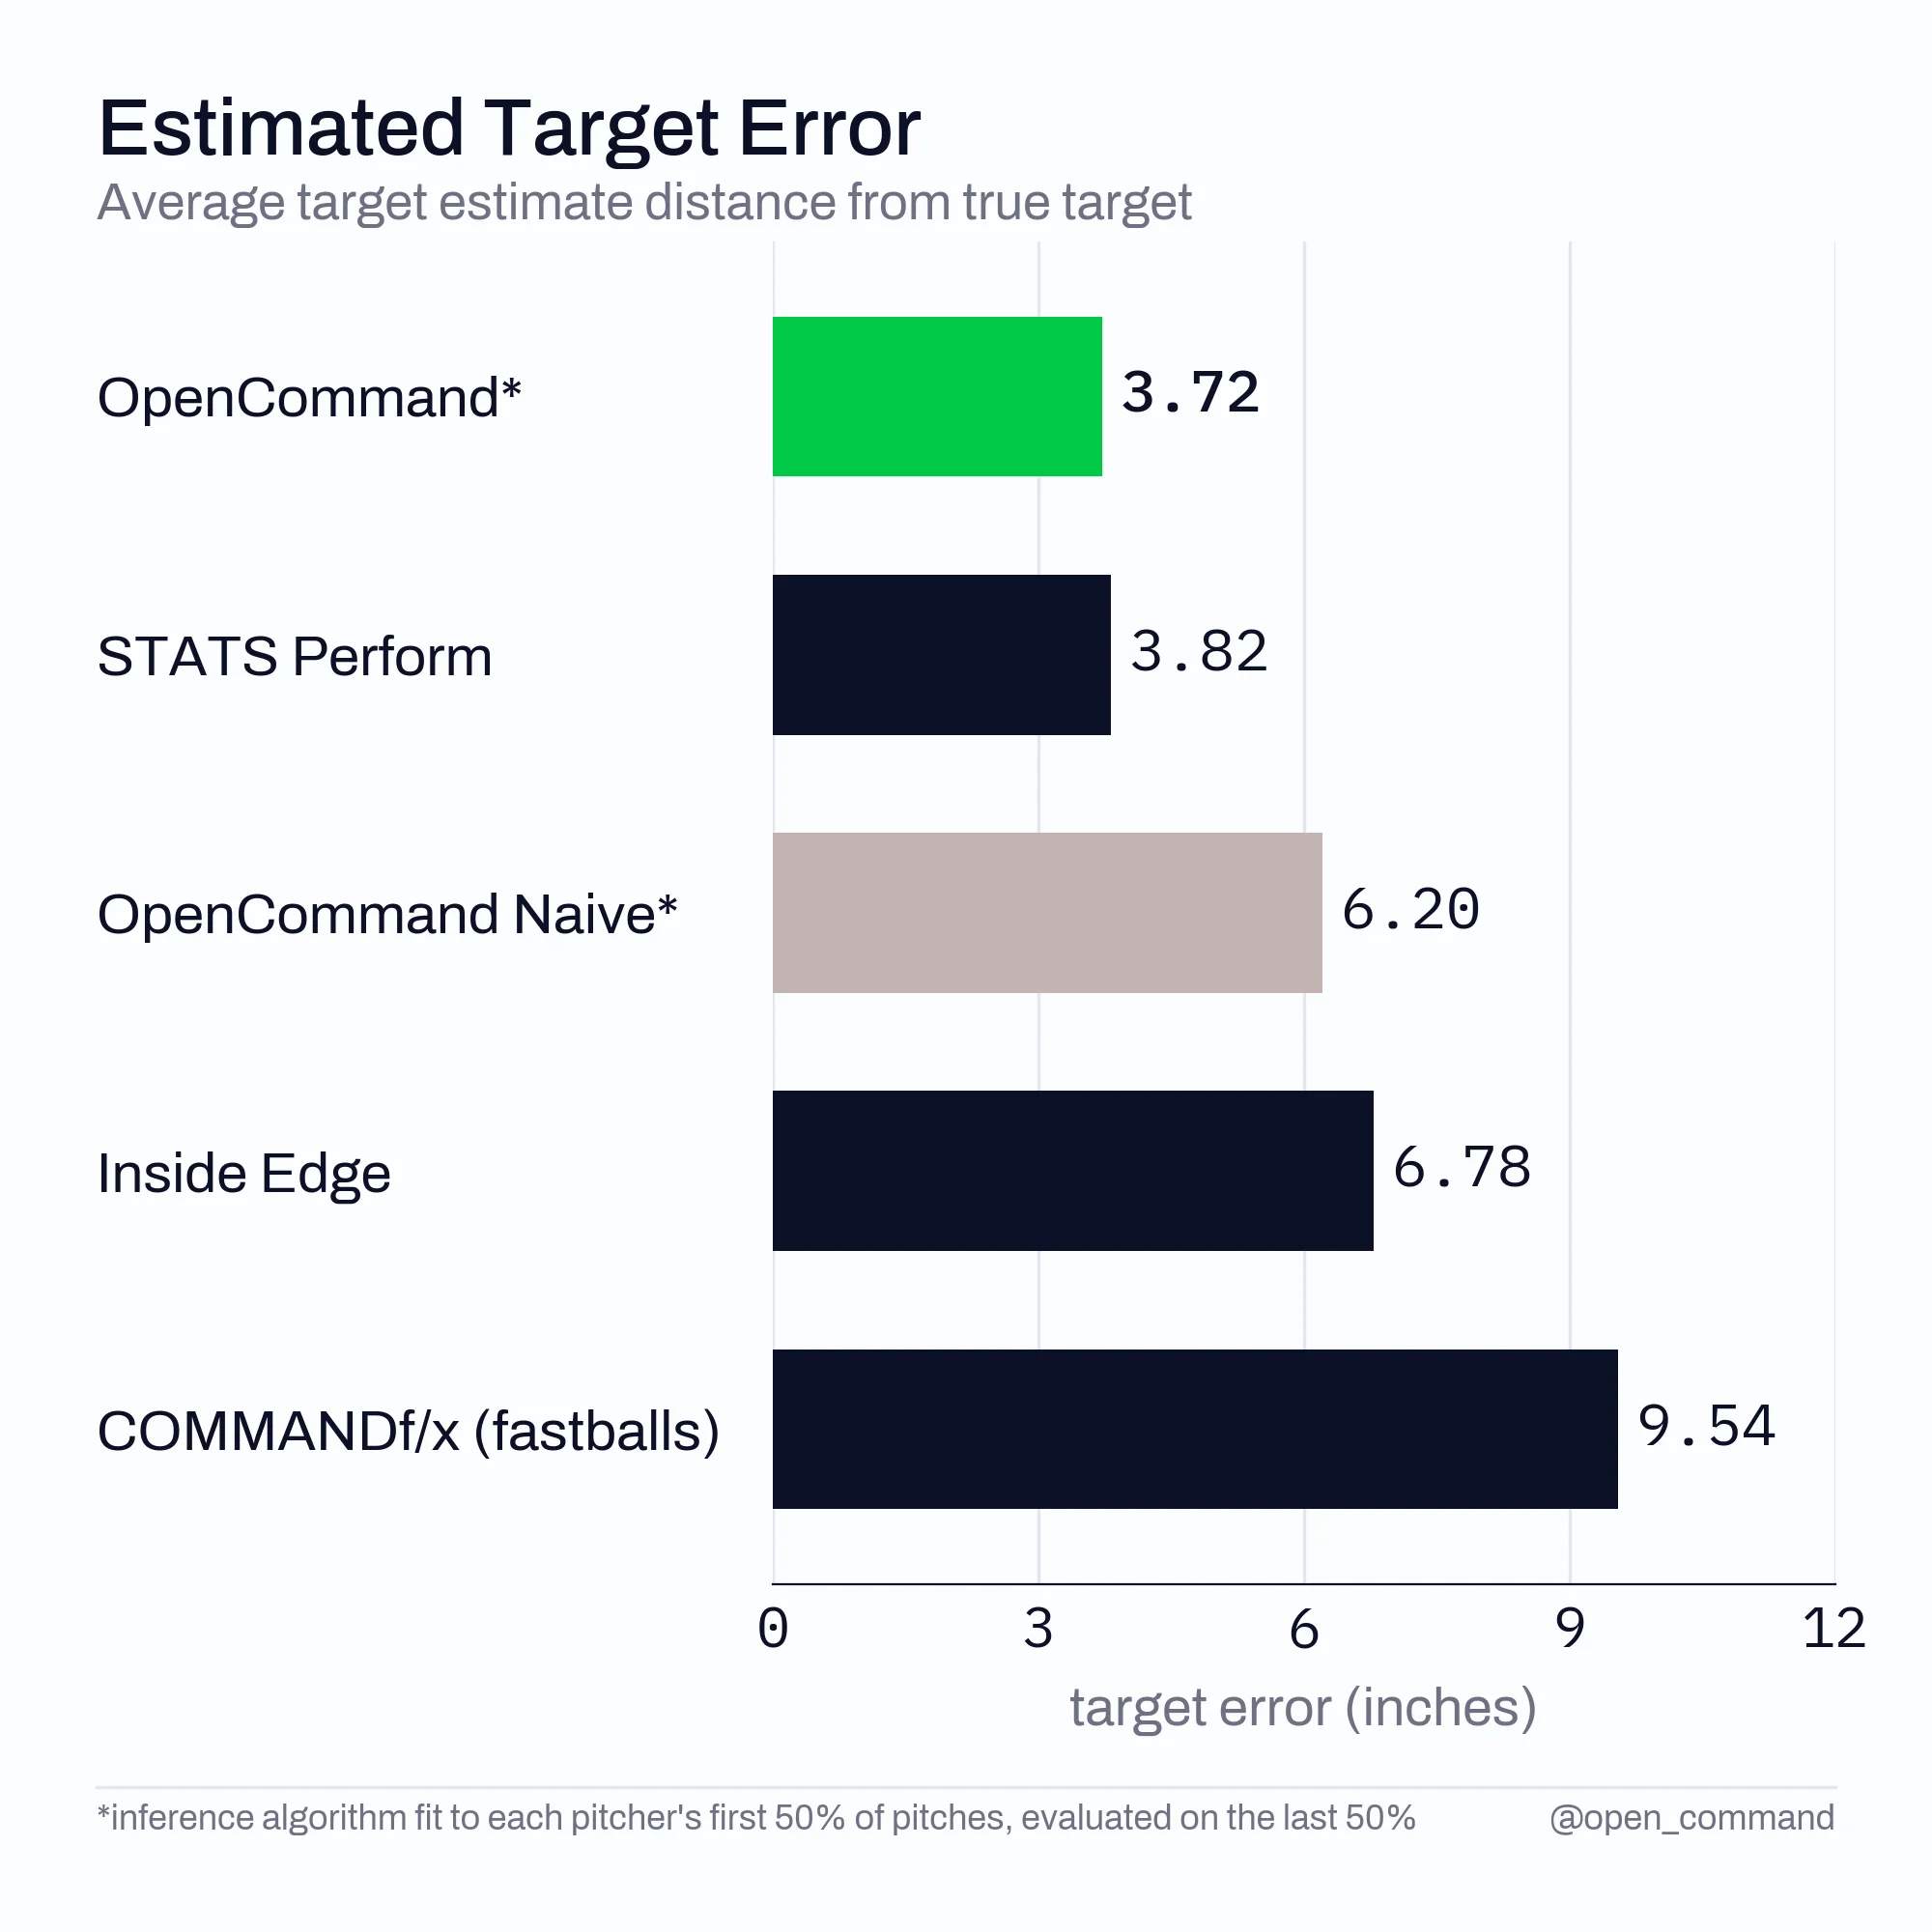
OpenCommand leverages computer vision technology to refine how we measure a pitcher's command, achieving a notable average miss distance of 9.91 inches.
Introduction
Assessing a pitcher's command has long posed challenges in baseball analytics, yet recent advancements hint at a potential breakthrough. While traditional methods have provided insights, such as COMMANDf/x's average fastball miss of 13.8 inches and Driveline's reported 11 inches, OpenCommand establishes a new standard with an impressive average miss of just 9.91 inches. As an open-source model, it invites collaboration and scrutiny in a field that thrives on data transparency. This shift toward openness is critical, as it allows teams and analysts to improve their strategies based on shared data.
Mechanics of OpenCommand
The engine behind OpenCommand hinges on capturing the movements of the catcher's glove. By analyzing the glove's position in relation to typical pitch targets, the model adjusts for glove dependence, effectively improving pitching accuracy analysis. Prior models merely approximated pitch-target dynamics; OpenCommand aims for precision by directly measuring glove movements in real time.
Here's a quick overview of how OpenCommand operates:
- Identify the glove, the ball, and the broadcast strike zone in each frame to convert screen coordinates into real-world glove positioning.
- Determine the frame where the catcher sets the target position.
- Adjust that frame towards the expected pitch endpoint based on historical data for that pitch type.
- Account for the variation between the pitcher's actual targets and glove movement.
This method not only maximizes the data from each pitch but also enhances understanding of how a pitcher's style contributes to their effectiveness on the mound. With conventional methods limited by arbitrary definitions of command, OpenCommand’s objective approach marks a notable pivot.
Detection and Target Selection
Employing YOLO11 detectors trained on over 100,000 samples, OpenCommand accurately locates the catcher’s glove and the ball as well as the corresponding strike zone in individual frames. The precision of these detectors marks a significant leap in the technology used for pitch analysis.

This technology translates glove movement into precise pitch-target analyses, utilizing a pinhole camera model tailored to each pitch scenario. The thoughtful design of this model makes it adaptable to a wide range of pitch types and situations on the field.

The yellow box indicates the detected strike zone, while the circles highlight the glove's position relative to that zone.
Addressing Glove Position Challenges
OpenCommand primarily targets the highest glove position in the pre-pitch window. This method generally proves effective, but uncertainties arise, especially when pitchers employ decoy signals with runners on base. Such tactics complicate the identification of a pitcher's intent, introducing variables that previous methods may not account for.
To address this, the model modifies its approach by penalizing earlier glove peaks, ensuring that it captures the most relevant target position. This adaptability is essential in a sport where deception often plays a key role in determining outcomes.
Pitch Types and Glove Dependence
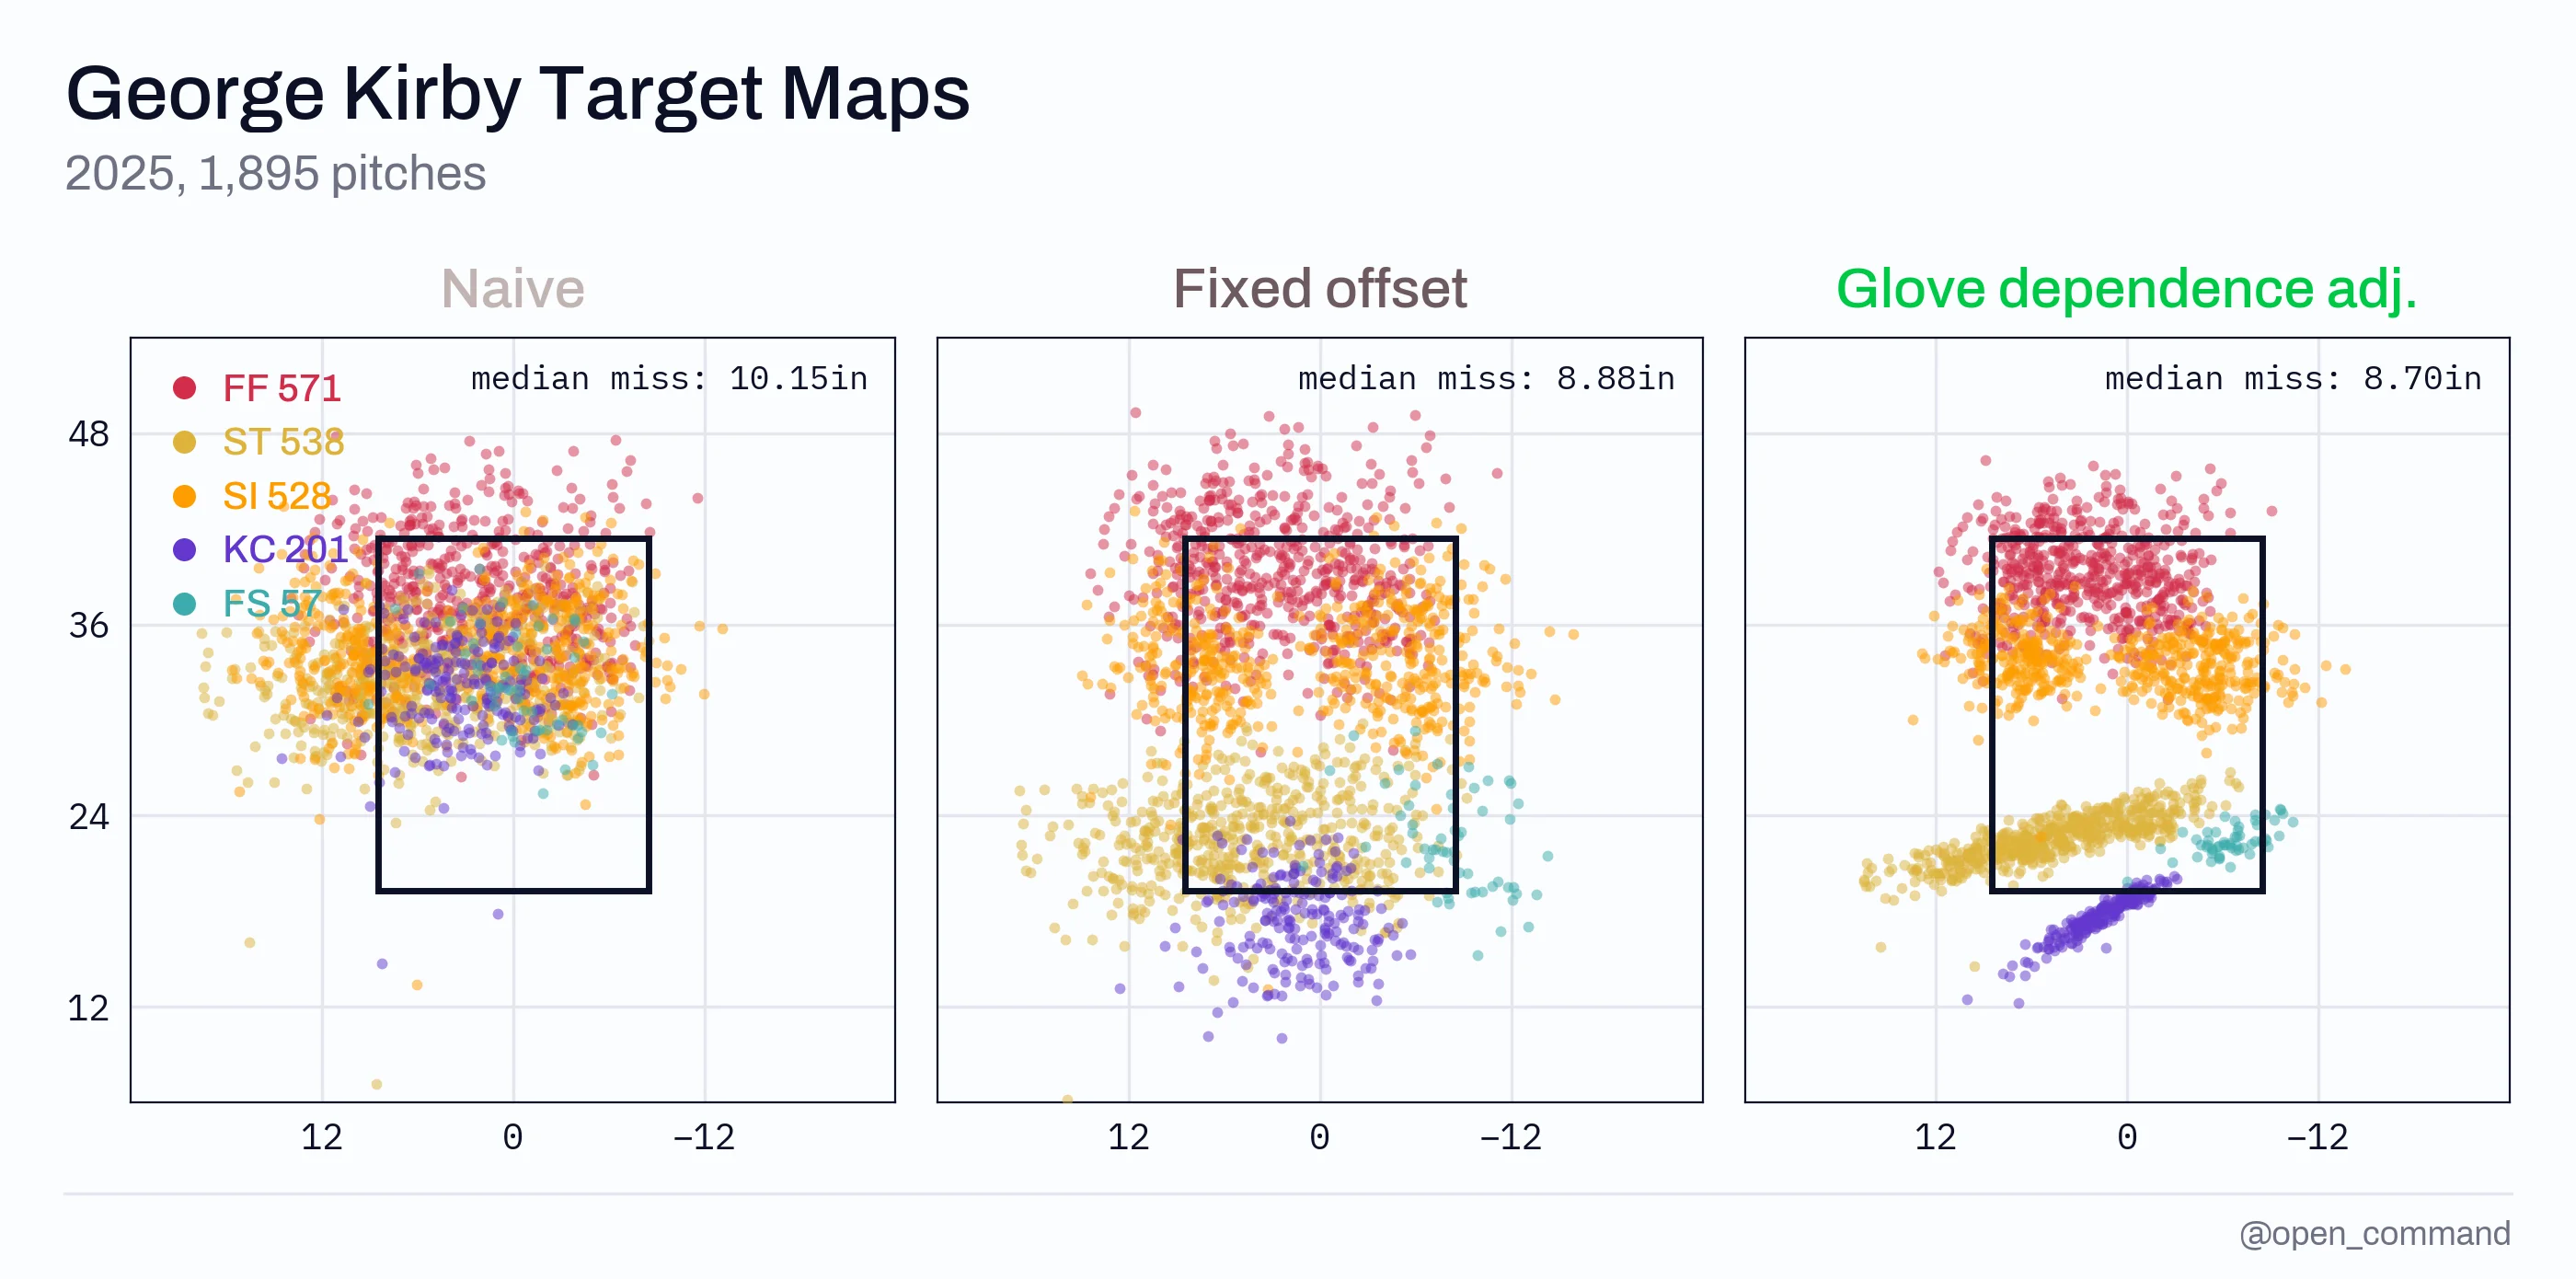
Another key insight is that pitchers often don’t throw exactly where the glove sets up. For instance, certain pitchers, like Logan Webb, show significant average offsets that necessitate adjustment from the glove's position. Such discrepancies can skew statistical outcomes if left uncorrected.
To correct the target projections, OpenCommand applies the average throwing offsets specific to each pitch type, enhancing the accuracy of target predictions. This meticulous attention to detail transforms the way pitchers' performance can be understood and analyzed, ultimately influencing game strategies.
Performance Validation and Data Insights
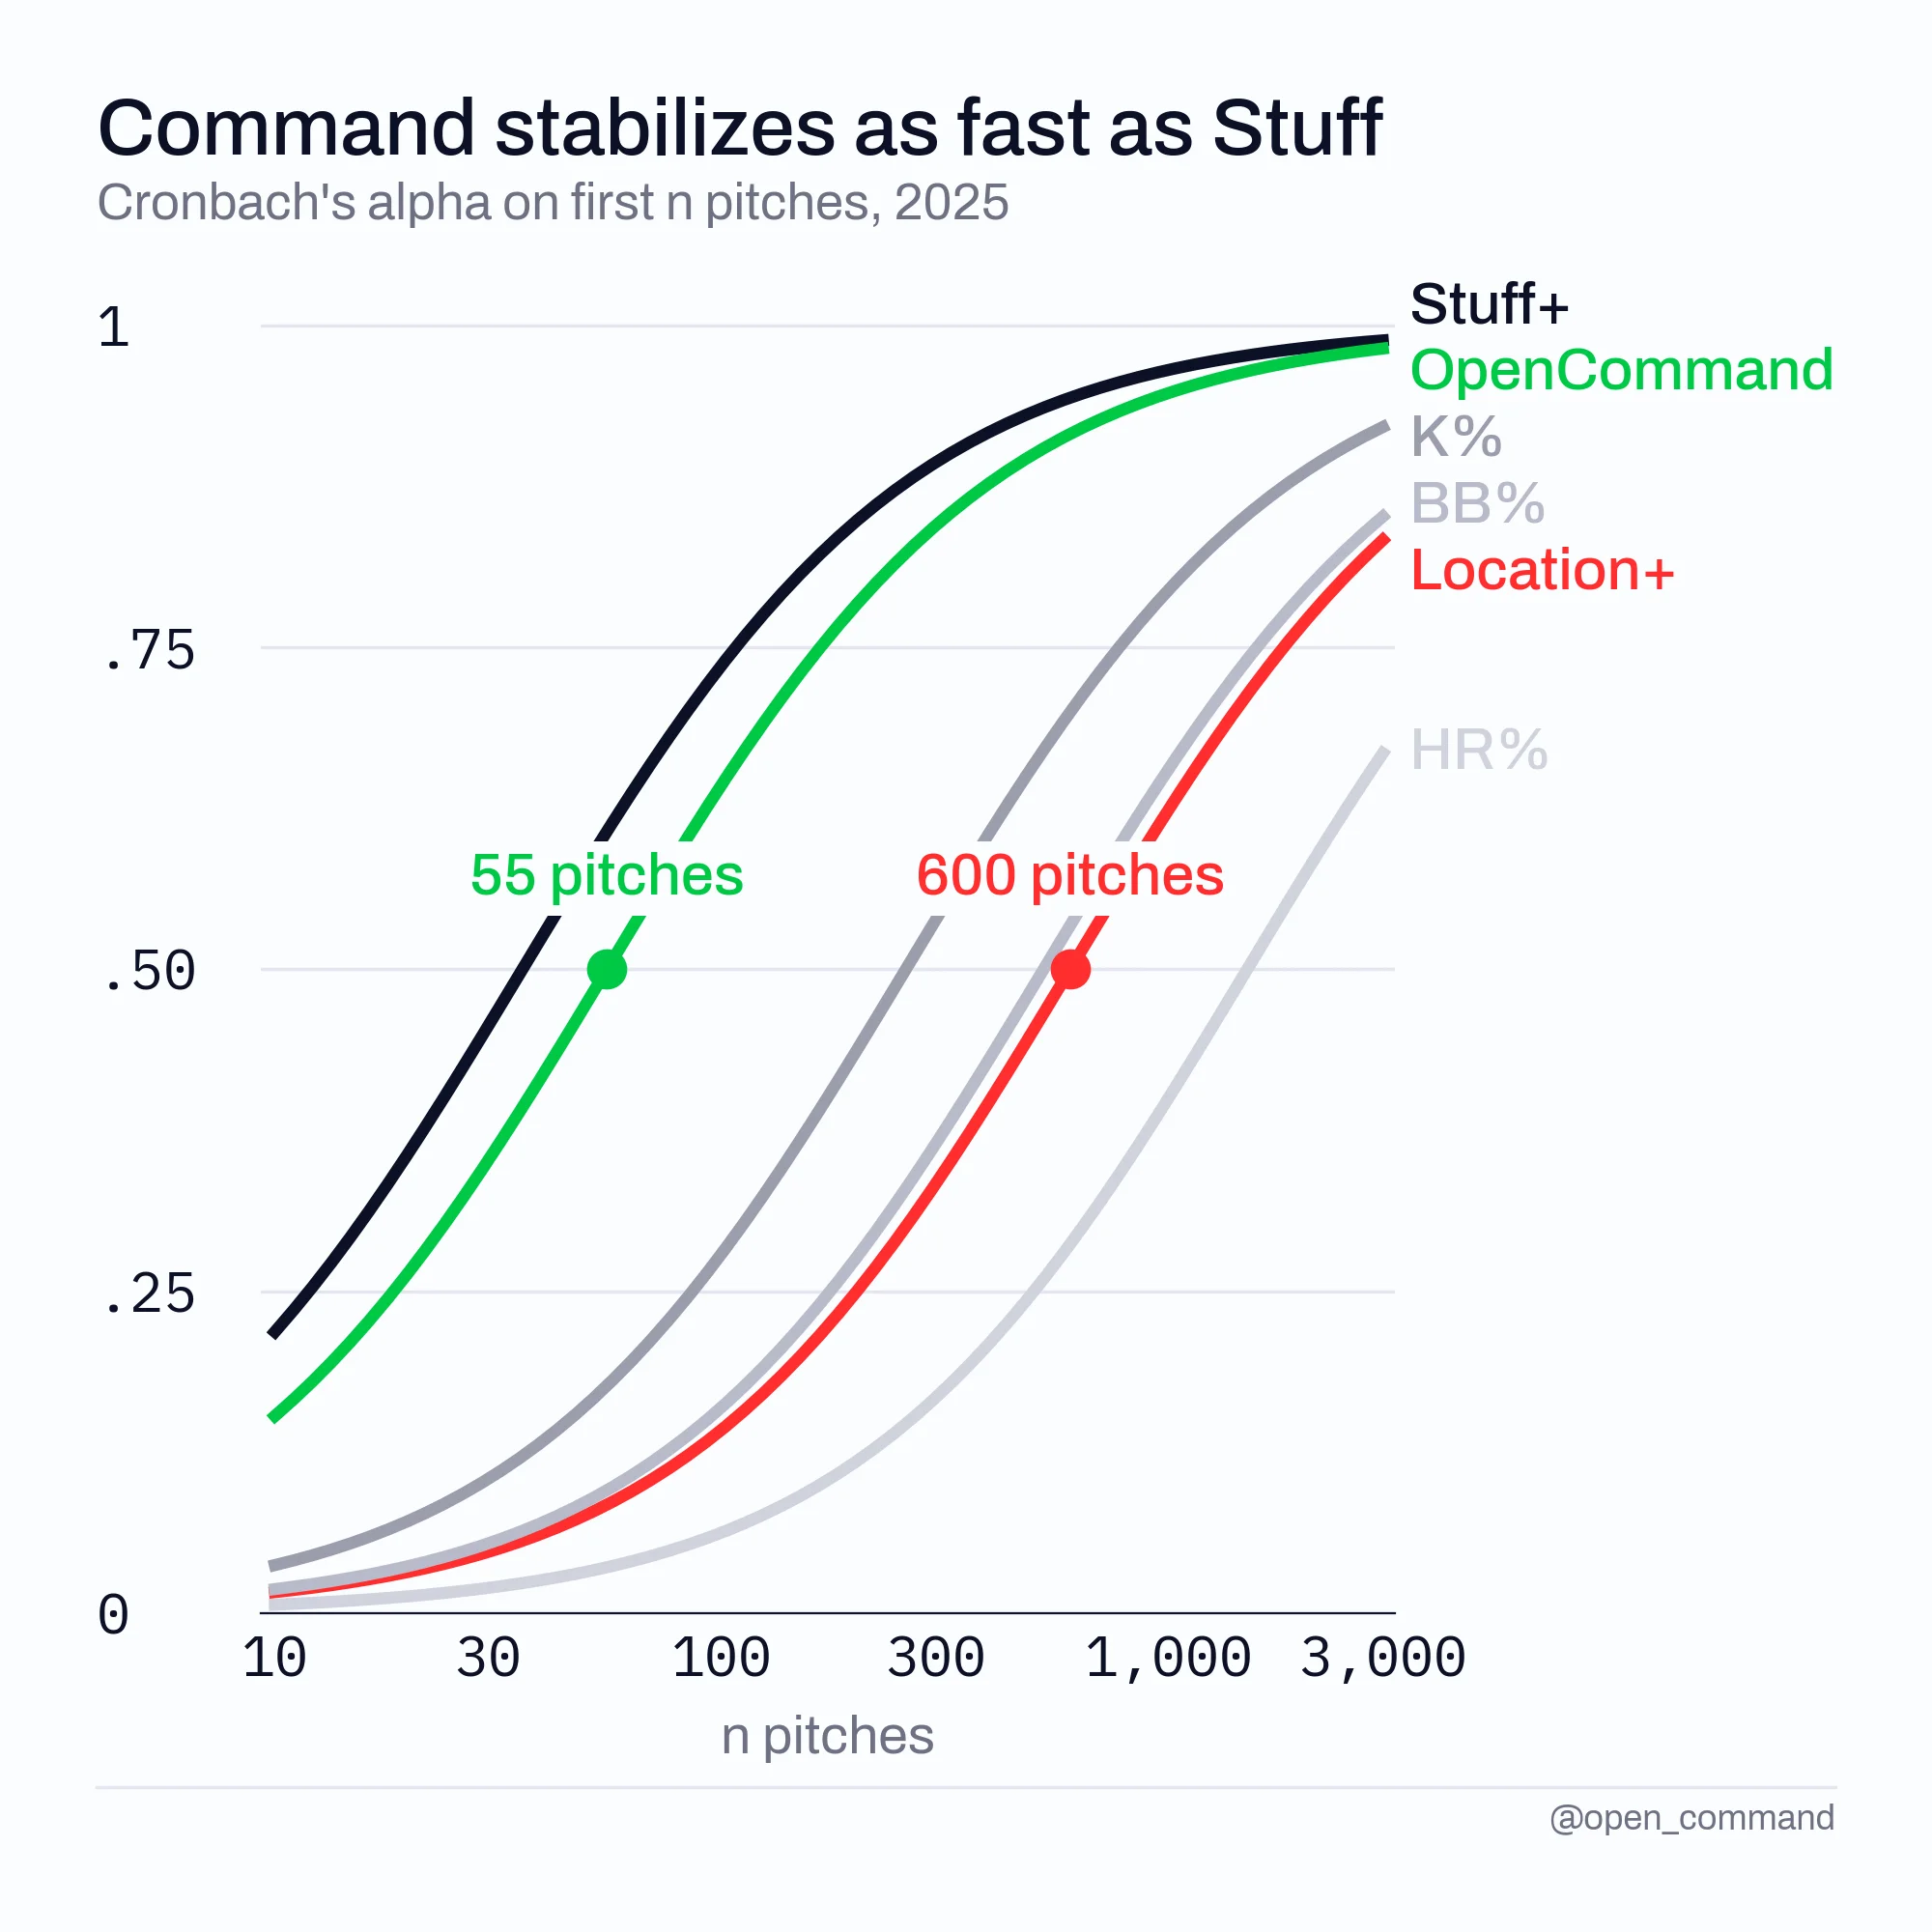
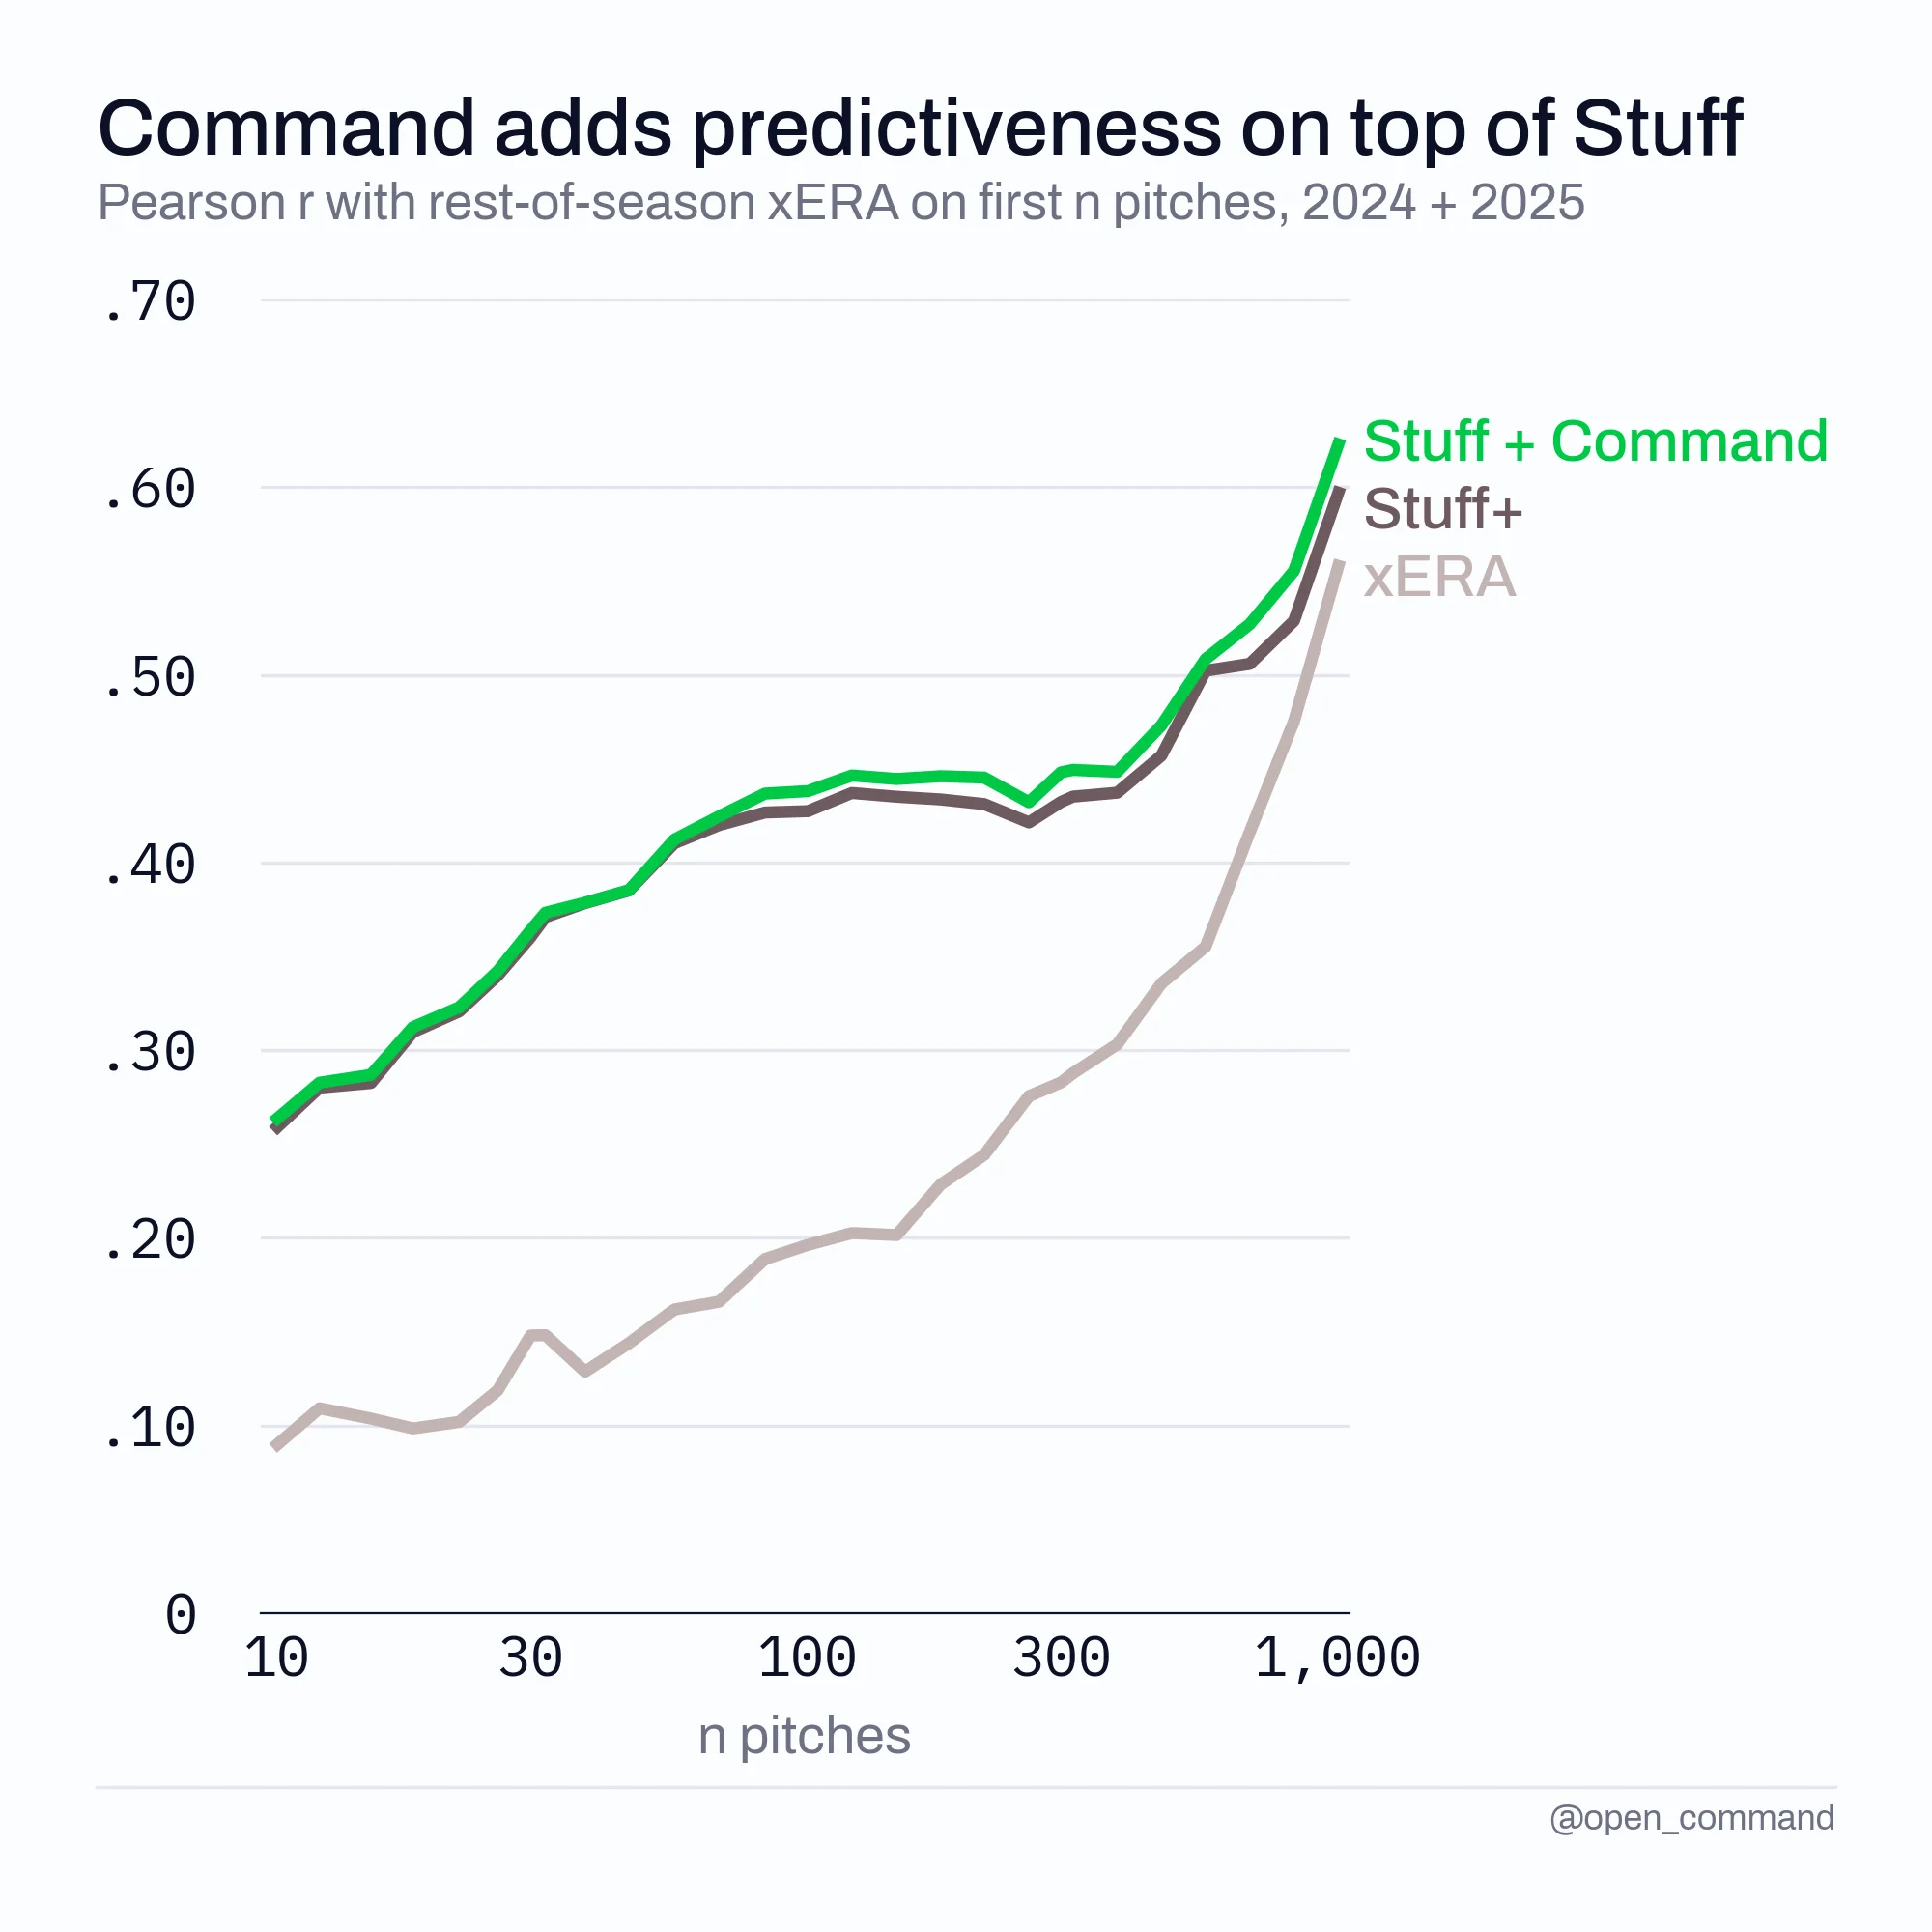
OpenCommand's adjustments produce tangible differences in target mapping, stabilizing quickly in performance metrics. The inferred miss reaches a reliability metric of 0.5 after just 55 pitches, offering significant insight compared to traditional metrics like Location+. This speed in reaching reliability is notable, indicating the model's immediate applicability in both game situations and training environments.
The consistency of command performance across seasons is a notable feature; for instance, correlation between years stands strong at 0.84, outperforming many traditional statistics. This long-term reliability suggests that OpenCommand could become the preferred analytics tool for evaluating pitcher performance over time.
As inferred miss distances influence pitching outcomes, the model demonstrates predictive power for walk rates, intent on viewing these measurements as timely indicators rather than static stats. This approach allows coaches and analysts not just to react but to proactively adjust training focus and game plans.
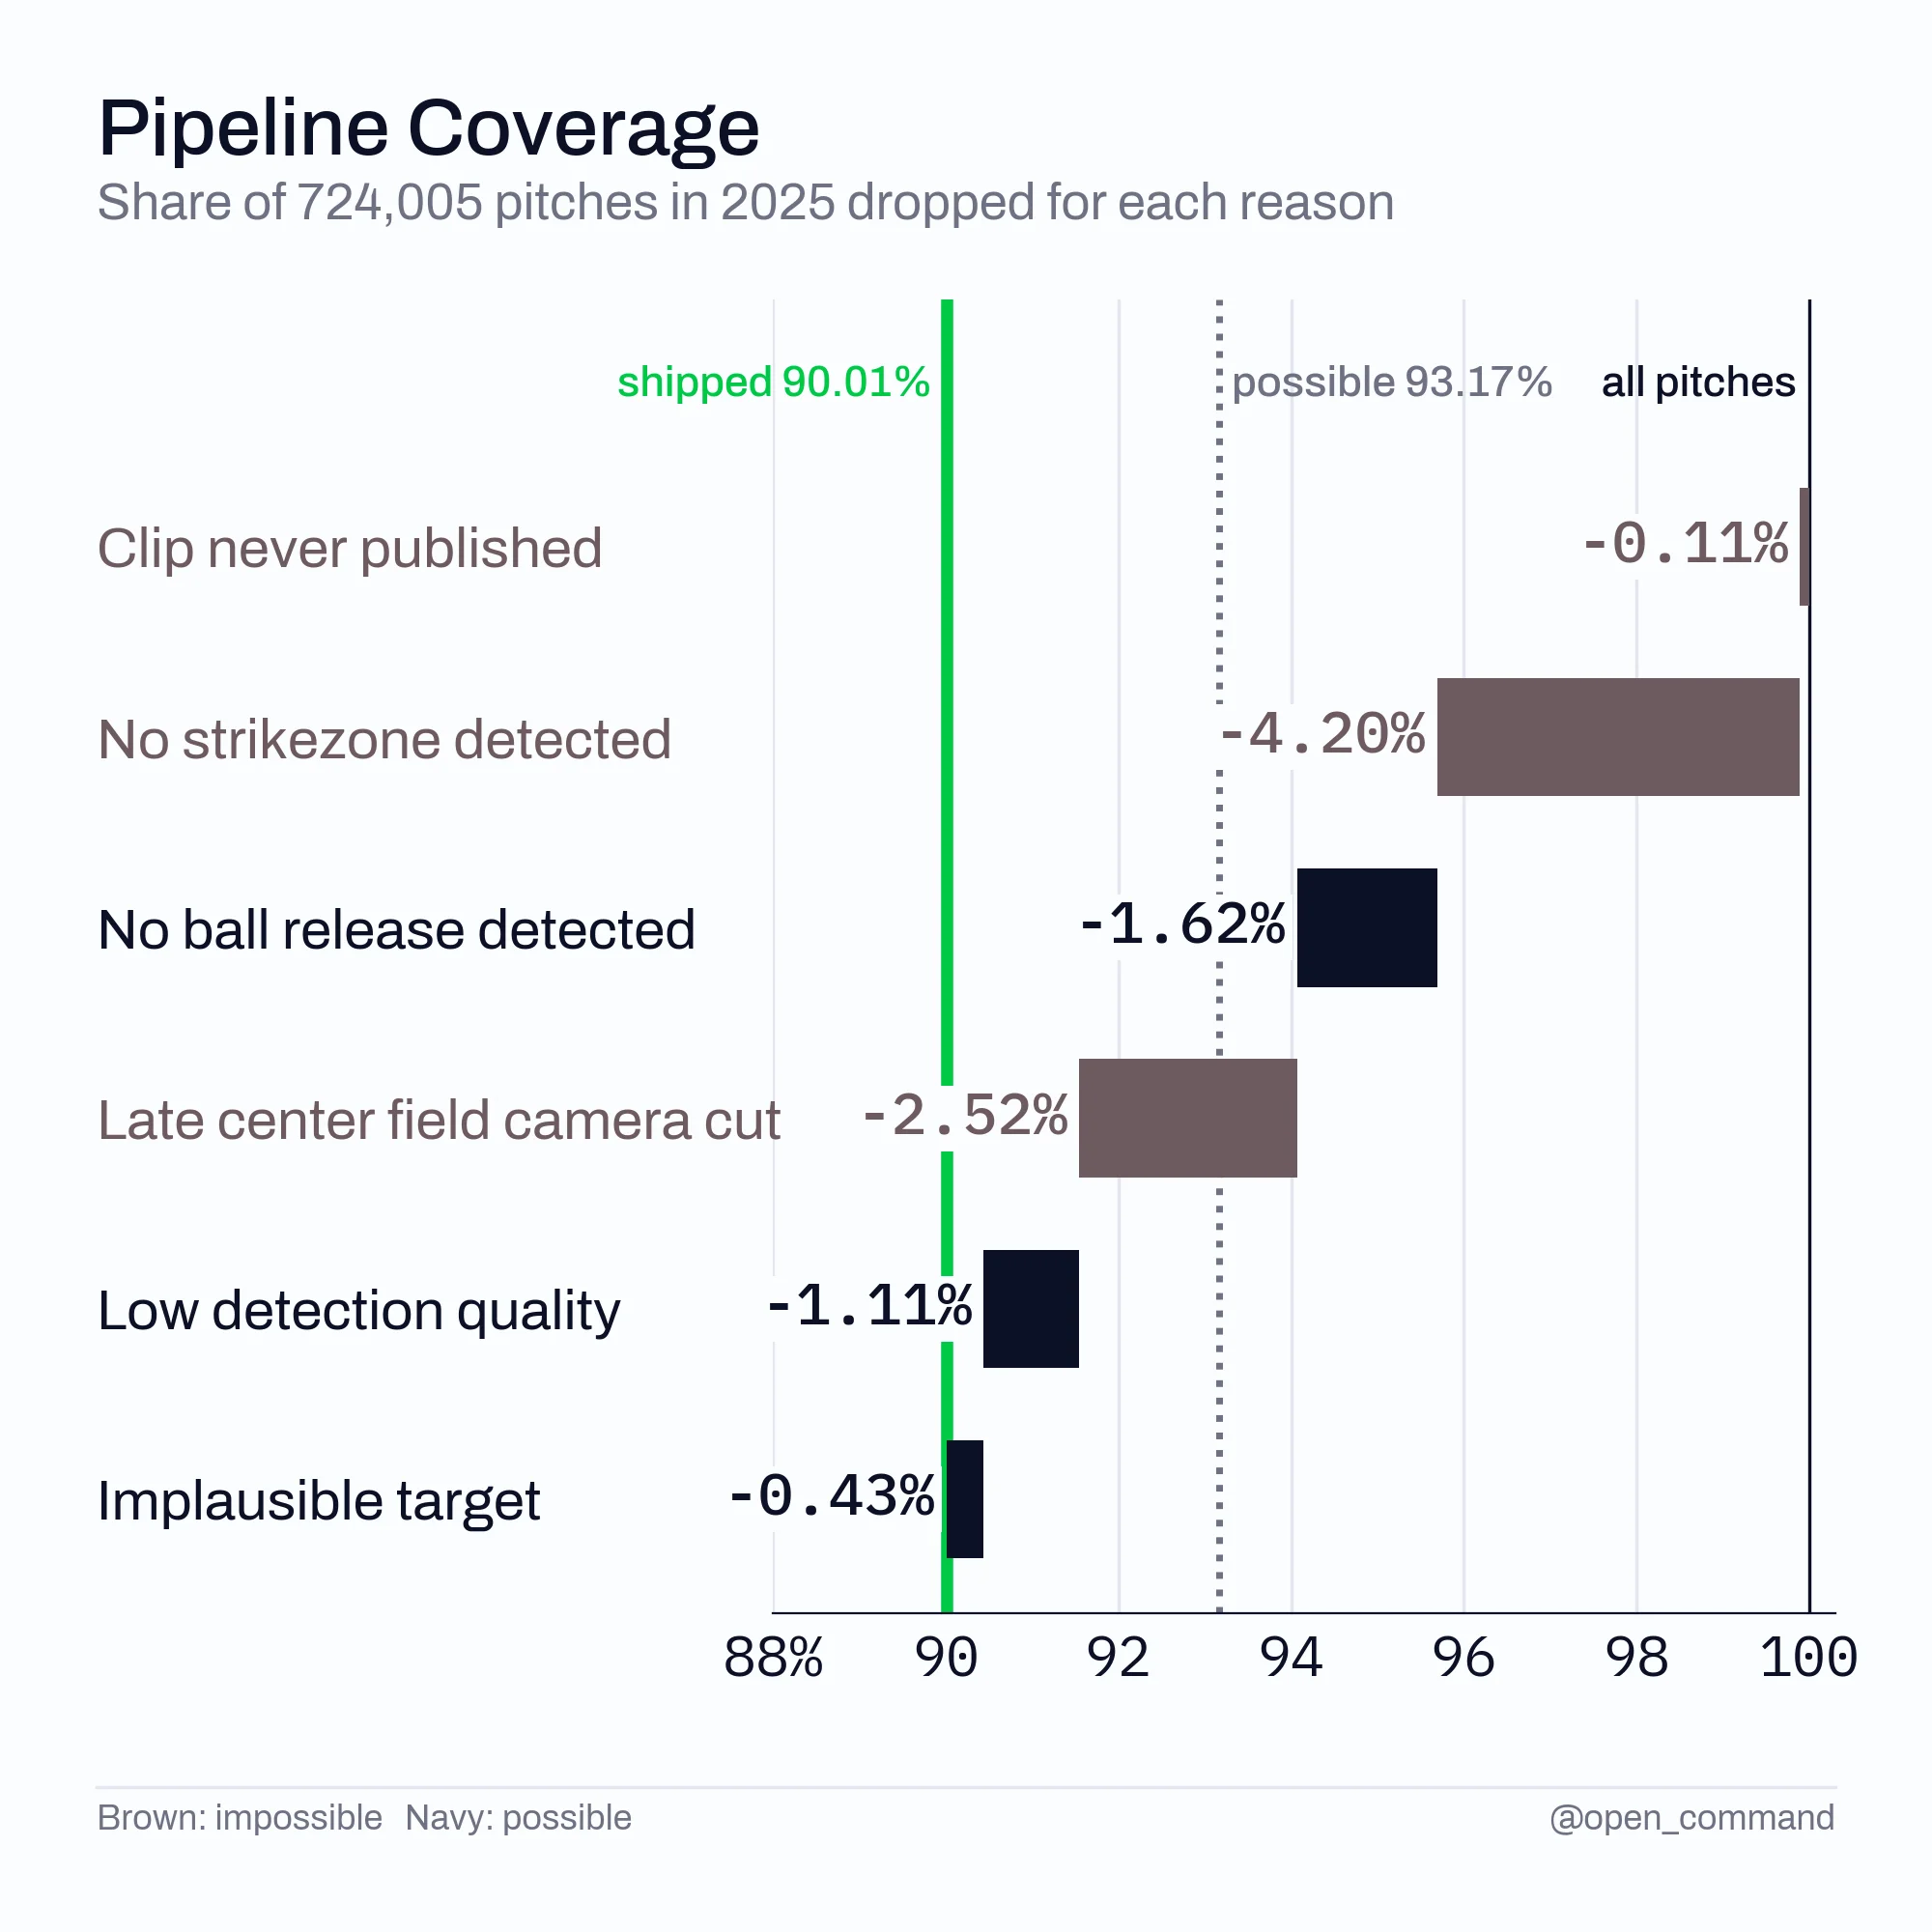
Intriguingly, OpenCommand's ability to track pitches remains exceptional, aside from constraints imposed by broadcast limitations. This opens the door for further refinement in data acquisition techniques.
Implications and Future Outlook
The introduction of OpenCommand represents more than just a technical advancement; it signifies a shift toward more precise, actionable data in baseball analytics. By enabling deeper insights into pitching command, teams could better scout talent and optimize player performance, which could affect everything from player trades to contract negotiations. If you’re working in this space, this model offers a fresh perspective on how to evaluate pitching strategies. Given the pace of technological growth, it’s likely that future iterations of OpenCommand will not only refine existing metrics but also facilitate the introduction of entirely new ones, reshaping our understanding of pitchers’ capabilities on the mound.
Connect with Tom on X (Twitter) at @tomdoyo and Luke at @lukeblomm.
The source material can be found on Baseball Prospectus.
Discussion
Sign in to join the discussion.